Why "it passes the tests" means nothing in AI
A message comes in from the client. "Something feels off with the agent today." You look. Logs show no error. The model responds. Tools return 200s. The system isn't down. What's happening is more subtle: responses have become vaguer, they cite sources worse, they escalate to humans more than they used to. There's no binary failure. There's a degradation.
In classic software this rarely happens. A function either passes its tests or doesn't. In AI it happens all the time — and the difference between a production system and an exposed experiment is being able to detect it before the client tells you.
That's why saying "we ran 100 tests and it passed" means nothing. Three reasons:
- The model is stochastic. The same input produces different outputs. A test passes against the rubric you applied; another rubric would have failed it.
- The system changes without you touching it. The provider updates the model, someone adds 200 documents to RAG, a connected tool starts returning a new field. Day-zero tests detect none of these.
- Success is multi-dimensional. A response can be correct and very expensive. Useful and slow. Well-cited and out of date. A single PASS/FAIL compresses too much.
EvalOps is the discipline that handles this: continuously measuring the quality of an AI system with operational metrics, alerting when it degrades, and giving the team tools to understand why — without waiting for a human to complain.
The three axes you have to measure
Almost every project measures one thing — "is it responding well" — and lumps together dimensions that should be separated. The three that actually matter:
Retrieval. Does the system retrieve the right information to respond? Applies especially to RAG, but also to any agent that searches before acting. Operational metrics:
recall@k— of the k retrieved fragments, how many were actually relevant.MRR(Mean Reciprocal Rank) — how high the first useful fragment appears.nDCG— the quality of the full ranking, not just the top-1.- Similarity-score distribution — if the average drops over time, something in the index is aging.
Agent action. Did the agent pick the right tool? Did it call it with the right parameters? Did it decide to escalate when it should have? Metrics:
- Task success rate — percentage of tasks completed end to end without escalation and without failure.
- Tool success rate — percentage of tool calls returning without error and with the expected result.
- Decision precision — on critical actions (escalation, approval, rejection), did the agent get it right?
- Mean cycle time — from input to complete output.
Response quality. Is what the agent returned to the user correct, complete, and well-grounded? Metrics:
- Groundedness — percentage of statements in the response backed by the retrieved sources.
- Factual accuracy — percentage of verifiable facts that are correct.
- Tone and format — the response fits the rules the agent was told to follow.
- Citation correctness — citations point to the fragment that backs what's stated, not another.
These three dimensions break for different reasons and deserve separate metrics. When quality drops, the first thing a serious team looks at is which axis: bad retrieval? bad action? bad response generated from good retrieval? That diagnosis decides where to act.
LLM-as-judge: when it helps and when it doesn't
For many of the above metrics, there's no deterministic formula. "Is this response well-grounded?" isn't answered with a regex. The common alternative is to use another LLM as judge: hand it the question, the response, and the retrieved fragments, and ask it to score.
LLM-as-judge works — under conditions. The operational rule we apply:
It helps when:
- The rubric is well-defined with concrete criteria (not "rate the quality", but "does each statement have a fragment that backs it?").
- The judge is a different model from the one being evaluated (avoid the model judging itself and inflating).
- The rubric has been calibrated against human review — 50-100 cases passed through both human and judge, agreement compared, rubric tuned until agreement is high.
- Judge scores are interpreted in aggregate (trends), not absolute value.
It's a bad idea when:
- It's used for subtle criteria (creativity, business tone, "elegance") without prior human calibration.
- Judge and evaluated share architecture — models tend to prefer responses in their own style.
- It's interpreted as ground truth. A 4.3/5 from the judge isn't 4.3/5 real; it's 4.3/5 according to the judge.
A pattern that does scale: combine LLM-as-judge for high volumes with weekly human sampling of 20-30 cases. The human calibrates the judge; the judge evaluates the volume.
Drift detection: silent degradation
The most insidious part of operating AI in production isn't failure. It's gradual degradations no one notices until they reach a business metric.
Three kinds of drift to watch:
Model drift. The provider updates the model without changing the endpoint. Responses change subtly. Your agent goes from always citing sources to forgetting in 8% of cases. Without a continuous eval that samples daily over a fixed dataset, you don't catch it.
Data drift. RAG starts retrieving worse because the indexed documents are no longer representative of incoming questions. Internal naming changed, 200 new documents added ambiguity, a source went stale. Embeddings that used to point to the right fragments now point elsewhere.
Usage drift. Users start asking different things. The agent was designed for cases A, B, and C; now D and E are coming in, and it muddles through with decreasing quality. Logs show longer responses, more escalations, longer times.
All three are detected the same way: a continuous eval running over a representative dataset and comparing metrics against the historical baseline. When a metric drifts beyond a threshold, an alert fires. Without that, the first signal is a user complaint — and by then the problem has been live for weeks.
Shadow runs and canary releases for agents
In classic software there are blue-green deployments, canary releases, feature flags. In AI there are equivalents almost nobody is applying.
Shadow runs. When you're about to change the model, the prompt, or the retrieval pipeline, you don't switch in production all at once. For a week or two, every real request runs against the old version (which responds to the user) and, in parallel, against the new version (whose response is only stored). Then you compare: does the new one improve the metrics or hurt them? In which case classes? If the data is good, promote. If not, adjust without a single user being affected.
Canary releases. When the new version clears shadow, it's deployed to a small percentage of real traffic (1%, 5%) before the rest. Metrics are watched in real time and, if any indicator drifts, rollback is automatic. Only when canary holds for several days without deviation does it go to 100%.
Incident replay. When something goes wrong in production, the team needs to be able to reproduce the exact request with the context the agent had — the system prompt, the retrieved RAG fragments, the tools called, all of it. If the incident can be replayed outside production, it's diagnosed in minutes. If not, it's speculated on for days.
These techniques aren't exotic. They're normal engineering applied to AI's quirks. The specific quirk: in AI, the "code" includes the model, the prompt, the embeddings, and the indexed data. Changing any of the four is a deployment — and any serious deployment deserves shadow and canary.
EvalOps as a pipeline
Mature EvalOps isn't scattered scripts someone runs when they remember. It's a pipeline integrated into the development cycle:
- Change in code, prompt, or configuration → commit to the repo.
- CI triggers the evals. The regression dataset runs automatically. If critical metrics drop beyond the agreed threshold, the build fails.
- If the build passes, a more extensive eval (more cases, more metrics) runs in pre-production.
- If that eval also passes, promote to shadow run in production.
- After N days of shadow with stable metrics, canary release to X% of traffic.
- After stable canary, promotion to 100%.
- In 100%, continuous monitoring with alerts if any metric drifts.
What looks like overhead in a small project is what allows operating an agent without surprises in a serious one. And the cost of setting it up, once, amortizes across follow-up projects — because the pipeline is a reusable template, not an ad-hoc build.
FinOps: cost is also an eval
A correct, very expensive response isn't a good response. In production AI, cost per task is a metric that sits alongside the quality ones — and is monitored just as strictly.
What gets measured:
- Cost per complete task — input and output tokens, calls to external APIs, recomputed embeddings.
- Distribution by query type — knowing which question classes cost the most lets you optimize the expensive ones and leave the cheap ones alone.
- Prefix-caching efficiency — if your system prompt is long and repeats, caching should be eating a big chunk of the cost. If it isn't, there's a configuration problem.
- Routing between models — in mature agents, not every query goes to the most capable model. Simple ones go to a cheap one, complex ones to a powerful one. The router that decides is itself a system piece that gets evaluated.
Three tactics we apply systematically that cut cost without hurting quality:
- Aggressive prefix caching. The system prompt, stable RAG fragments, and tool descriptions get cached. Reduces per-call cost by 60-80% on repeated queries.
- Cheap/expensive routing. A first layer decides the query's complexity. Simple ones to a cheap model; only complex ones to the expensive one. In one of our support agents, this dropped average per-ticket cost by around 55%.
- History compression. Instead of sending 20 full turns, send a synthetic summary of the first 15 and the last 5 verbatim. The loss of nuance is marginal; the savings are huge.
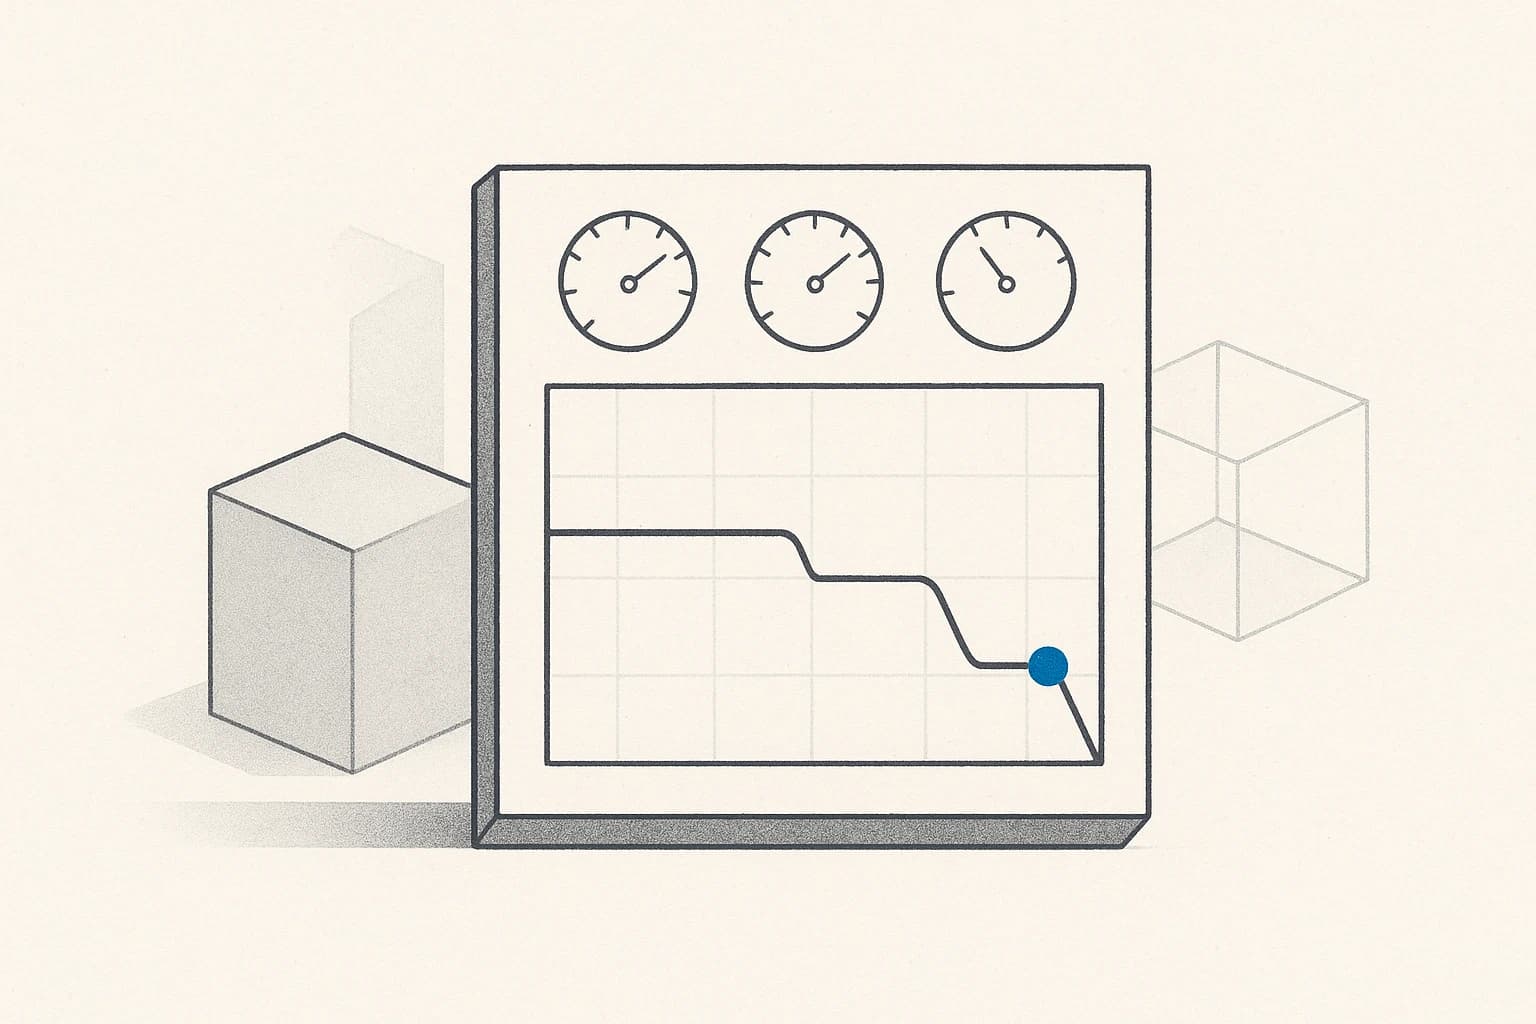
Without measuring cost, these optimizations never happen — because no one sees the opportunity. With a dashboard showing segmented cost per task, decisions take themselves.
How we build it in production
When a client asks us for a serious AI agent, EvalOps isn't an optional module — it's part of the deliverable from day one. On top of the agent's role map, we define which metrics measure whether it's doing its job, which evaluation dataset represents them, and which pipeline runs them. Without those three pieces the agent doesn't go to production; it stays in pilot.
We build the eval dataset from real client cases — including the ones that failed in the first month of use. Each case has the input, the expected output, the expected fragments (if applicable), and the judgment rubric. It lives versioned in the agent's repo. It grows over time: every interesting case appearing in production gets added.
The metrics dashboard (quality, cost, drift, escalations) belongs to the client. Not to a service of ours the client gets locked into. If six months in they decide to internalize or change partners, the dashboard keeps working.
Behind those pipelines is a team of engineers who believe that serious AI engineering starts by asking how you'll know if this is working, not by building the prettiest thing you can build. Technical excellence isn't the agent responding well today; it's the team knowing when it starts responding badly — before the client finds out.
Production means the system warns you when it's degrading, not that you wait for a user to complain. That's the difference between an operated agent and a deployed one.
If you have an AI agent in production and you're not sure it's performing the same as it did three months ago — or you have no way to know if it stopped — we can audit your system, set up the eval pipeline, and hand you the dashboard so you stop operating blind.